

Queens Real Estate Market Update First Quarter Q1 2021
(To download a pdf of this post, click here:q12021MARKETUPDATE )
First, let me start by sharing some of the National Macroeconomic data to put our Queens Real Estate Market Update in perspective. I realize that a lot of the information you get thru the media refers to the national real estate market and this can be very different to what is going on locally. Every real estate market is local, or shall we say uber-local, so when we hear national trends, we must put those in perspective.
First let´s look at GDP (Gross Domestic Product) Numbers, year over year:

https://www.bea.gov/data/gdp/gross-domestic-product
As you can see in this chart, at the end of the first quarter of 2021 GDP was 0.4% higher than last year, meaning that it recuperated fully and was even higher. The obvious interpretation is that the end of Q1 of 2020 started to see the effects of the pandemic, and then thanks to the massive government stimulus companies and individuals pulled the economy forward and out of a massive recession.
As far as the residential real estate market, the increased demand on single family homes brought about a record level in new construction permits. They reached a level not seen since 2017:

https://tradingeconomics.com/united-states/building-permits
So that is to say that building permits not only surpassed pre-pandemic levels of 2020, but were actually at levels not seen since prior to the last mortgage crisis of 2007-2009. The consequence was record level prices for lumber and construction materials, which are also affecting new home pricing.
A bright spot within the battered commercial sector were warehouses. Foreign investors kept gobbling up warehouse properties across the United States because they were in high demand due to the flourishing of e-commerce and online shopping during the pandemic. The rest of the commercial sector, especially retail and multifamily properties, were still very affected during Q1 2021.
This increase in economic activity also puts pressure on inflation and on bond yields and interest rates. Not only did construction materials go up, but gasoline, food, and many other consumer goods went up making investors and government regulators worry about the ghost of inflation. In that respect, mortgage rates did go up quite a bit.

http://www.freddiemac.com/pmms/
According to Freddie Mac, from absolute record levels of 2.65% for a 30-year mortgage, at the end of March 2021 the rates were up by 0.53%, or 3.18%. In our regular work of answering inquiries, listing, and showing homes, we did notice a decrease on interest and motivation from buyers in the highest price point markets. A ½ percent increase in interest may not be a big deal in markets where the median price is $300,000, but in some parts of New York City, where median prices are closer to the $1,000,000 mark, this difference in rates makes a bigger dent in home buying power, and buyer´s motivation.
Partially because of mortgage rates increasing, refinance applications went down in Q1 2021. This is also due to the simple fact that a lot of the people that were qualified and/or interested in refinancing did so already, making the pool of refinancing customers smaller. Mortgage applications for purchases did go up with the increase of sales transactions and were expected to go up in Q2 2021, as can be seen by this chart provided by the Mortgage Bankers Association:

https://www.mba.org/
According to Redfin, the median price of homes in the United States was 17% from a year ago.

Here I must remind you that these numbers are national and that the situation in Queens was quite different and that the Queens market showed great difference among the different submarkets (by area or type of property) as we will see below. Even when we analyze these numbers more locally, we can see that there was a huge difference in appreciation, where the metropolitan suburban areas (suburbs closer to large metropolitan areas) were favored the most and did go up in value the most. This accounts for the suburban exodus that we saw during the pandemic. This trend is showing some early signs of reversing and it will be interesting to see what the effect on suburban markets is during the next year… Here is the map by counties, by Zillow.

Now, if we look at the New York City Metropolitan area and its suburbs we can see big discrepancies from County to County:

You can see that the Manhattan County did suffer a decrease in median price (dark blue in the map above). The other boroughs, including Queens, had recuperated to similar levels of a year ago by March of 2021 and maybe gone up a little. Suffolk County in contrast, and Nassau County to a lesser extent, so an increase in price more in line with national trends due to the influx of buyers from New York City. The Hamptons in particular, were on fire, because affluent buyers from the city purchased and moved into property where they could live, exercise, work remotely, teach children, and entertain. Having a swimming pool was a big luxury during the pandemic. We might forget that soon, who knows. The brightest spot was Ulster county (dark orange in the map above) where median home prices were up by 9%.
To start focusing more into our local market, let´s look at the Recovery Index, which looks at a combination of factors like covid related hospitalizations, real estate closings, rental inventory, subway ridership, unemployment rates and restaurant reservations. According to this Index put up by Investopedia, New York City was back to a 44% level of normalcy in February 2021:

Now let´s look at the actual Queens statistics.
Residential Contracts and Closings in Queens, Q1 2021

You can see that median prices for properties that went to contract (or that show as pending in the local MLS) ended the quarter up by 8.4% year over year at $619,000. The transaction numbers for contracts signed this quarter show that January and February they were below numbers last year. But March 2021 showed an increase of 7.7% over 2020.
The prices for actually closed property were higher and trending higher in all the 3 months of the first quarter of 2021 ending at $630,000 or 6.8%. Transaction numbers for actual closings were lower compared to 2020 but improving month over month in the first quarter of 2021.
The most interesting part is that even though contract prices were higher, the median prices of homes going to contract was $619,000 at the end of the quarter, which is lower than the median price of homes closing in the same period at $630,000. An explanation to this may be the increase in interest rates at the end of 2020 and beginning of 2021, affecting the purchasing power and motivation of buyers in the first quarter of 2021.
Now let´s look at the inventory levels in Queens and the negotiability rates (difference between contract price and asking price.:


As you can see the difference from asking to contract price decreased from 5.3% in January to 4.2% in March, showing a stronger position for sellers. Inventory levels ended up at 6.2 months of supply in March 2021, which is usually considered a levelled or balanced market. It is important to note that residential inventory in Queens was high during the pandemic and in the first quarter showed a tendency to decrease (it was 7.4 months of supply in January). In conclusion the residential real estate market in Queens shows signs of improvement and a tendency to favor sellers while still being in a balanced market (neither pure seller´s market nor pure buyer´s market). We will see that this picture changes when we consider the stats for different types of properties separately…
If we look at the activity for 1 and 2 families during the first quarter, we will find that it was better than larger multifamily.

The reason may be due to the fact that one families and to a lesser extent, 2 families, are usually homeowner occupied, and afford more privacy and space than larger multifamilies. Larger multifamilies were also affected greatly by tenant issues due to the pandemic and the obvious retreat of multifamily investors from the market. During the first quarter of 2021 there were signs of encouragement to both groups (owner occupied and investor properties).
One family ended Q1 at a median price of $715,000 which is an increase of 6.8% year over year. This is remarkable and reflects the demand to have more space for working at home, homeschooling, entertaining, exercising, etc. The sales activity for 1 family properties was still well below one year ago levels, Q1 of 2020, but improving ( 18% below in January to 14% below in March 2021 as compared to last year). You would think that this shows that there is room to grow in the 1 family sector in Queens, but this remains to be seen, as mortgage rates trended up at the beginning 2021, inventory levels started decreasing and the pool of buyers diminished because many of them went to the suburbs.
Two families ended up at a median price of $890,000 in March of 2021, which is 1.1% higher than a year ago. Not a big difference but a sign of stabilization, nonetheless. The sales counts were much lower than last year but improving slightly towards the end of the quarter to 19% below the levels of March of 2020. The volatility added by having that extra rental unit was evident for this property class.
Three and Four families were down year over year, ending at $1,232,500 or 2.4% lower in median sales price.

The reason is the fact that many tenants moved out or could not or would not pay the rent and that evictions were halted until June of 2021. Many small residential landlords suffered and had to resort to the limited relief provided by mortgage forbearance (which is when the banks agree not to get paid mortgage installments at a given time, because foreclosure were also under a moratorium mandated by the federal government). The sales activity for this class ended the quarter almost 20% below than the previous year but improving from the levels of January 2021 which had been over 31% below the levels of January 2020.
Coops and Condos experienced a surprising recovery. After the initial panic of living in shared settings and densely populated urban areas, Condos and Coops saw a resurgence during Q1 of 2021, mainly because their prices were attractive and the roll out of the covid vaccines provided a much-needed shot of optimism. Median prices ended up 2.2% higher year over year at $335,000. Sales activity were still lower than a year ago at 17.5% below the number of sale in March 2020 but improving from January 2020. News that Manhattan prices had crashed last year by 30% produced a rush of cash investors and user buyers for NYC, which may have spilled over to Queens.
A similar phenomenon happened to rentals. In New York City median asking rents went down by almost 20%. The situation was dire for many Queens landlords at the beginning of the year. I rented a 2br/1bth/2 balcony apartment in Astoria, close to the train for $1,800 which is almost $700 below prepandemic levels.

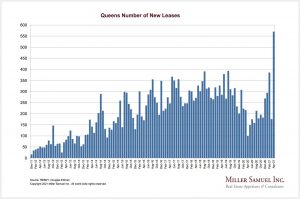
But these types of deals were snatched quickly by tenants who started moving back from the suburbs, or upgrading their apartments to take advantage of the lower rents. The quarter ended up with a record level of signed leases across New York City, according to Miller Samuel. Rent prices and vacancy rates quickly trended back to prepandemic levels towards the end of Q1 2021.
In conclusion we can say that the word for Q1 2021 in the residential real estate market of Queens was “Recovery” with a caveat due to the increase in mortgage rates. These are excellent times to buy a property in Queens where we don´t have the inventory shortages of the suburbs, yet. It may get to that if mortgage rates hold.
Thanks for your attention and do not hesitate to contact me if you would like to see specific information for your zip code or get a free, accurate, market evaluation of your property.
My mobile is 917-559-2002.

Copy Right Manuel Vargas 2021. All sources listed and credited accordingly.